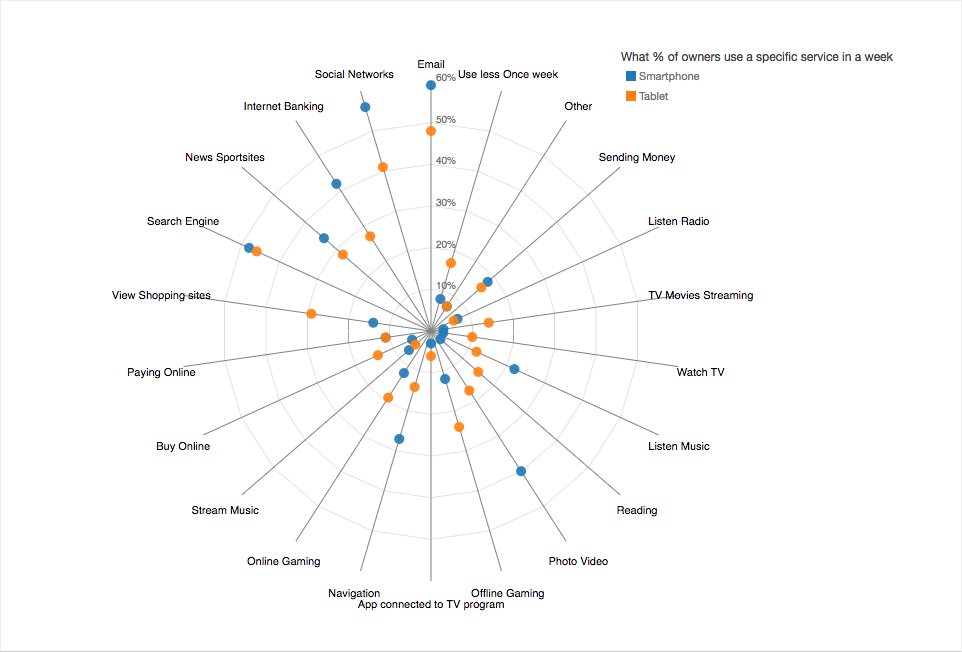
Math, Radars & D3.js


g.selectAll(".nodes")
  .data(y, function(j, i){
    dataValues.push([
      cfg.w/2*(1-(parseFloat(Math.max(j.value, 0))/cfg.maxValue)
      	*cfg.factor*Math.sin(i*cfg.radians/total)),
      cfg.h/2*(1-(parseFloat(Math.max(j.value, 0))/cfg.maxValue)
      	*cfg.factor*Math.cos(i*cfg.radians/total))
    ]);
  });


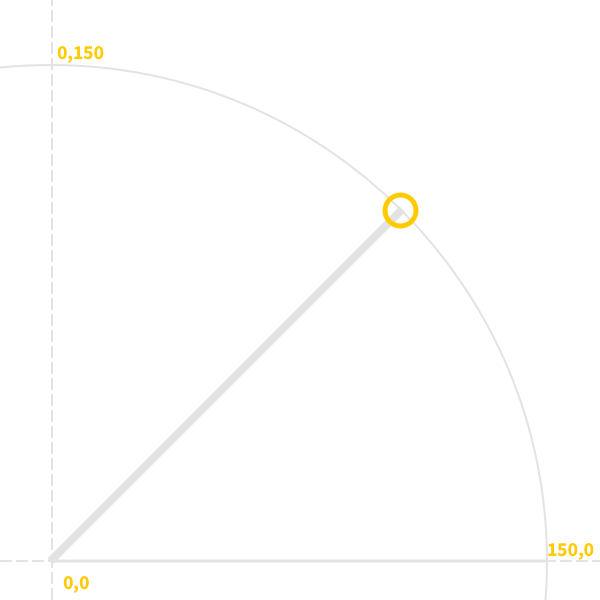
Let's start with:
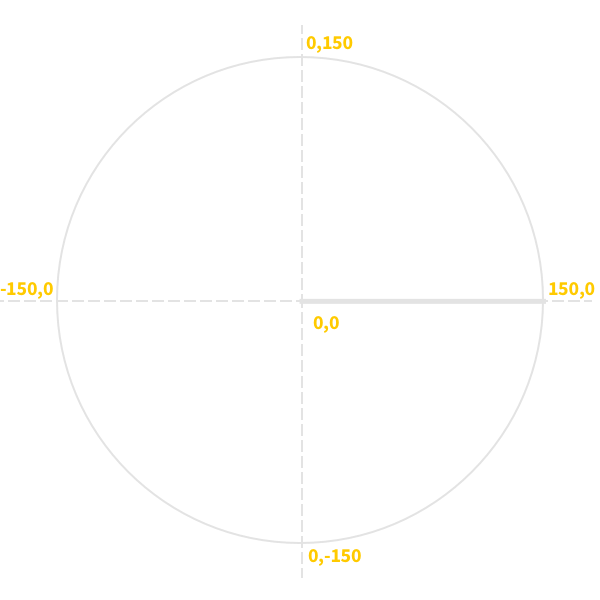
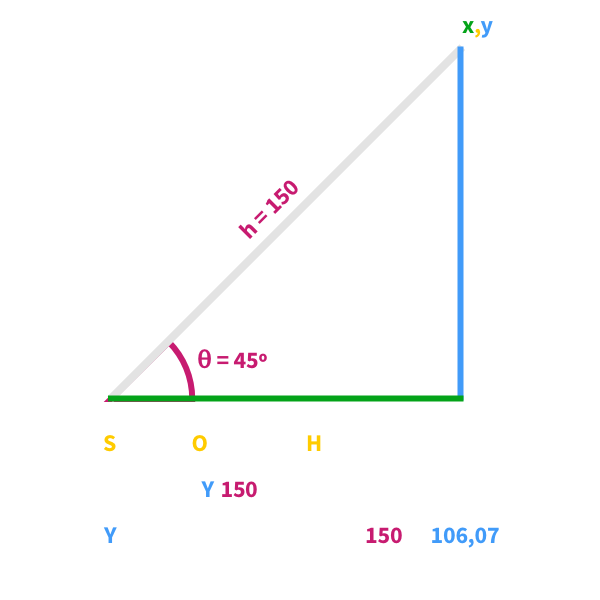
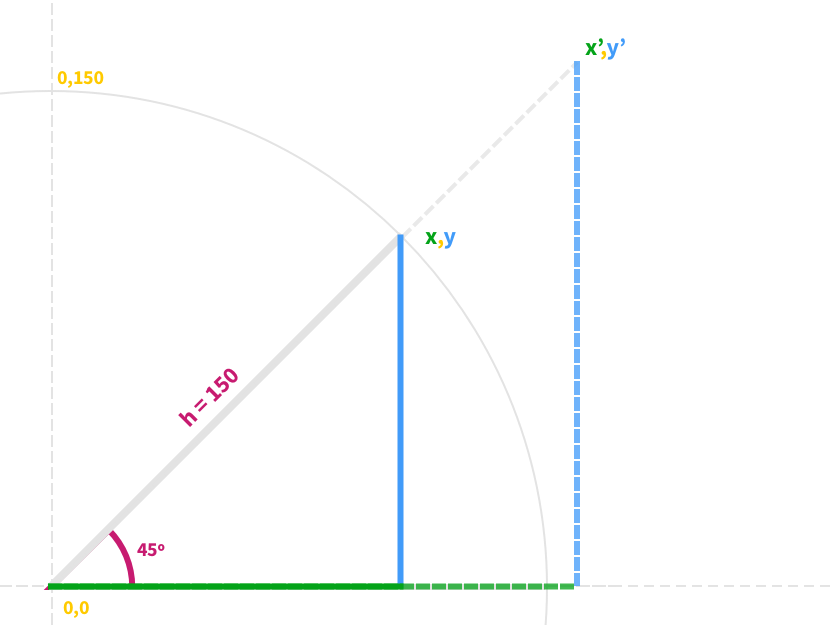
How do we calculate this point?
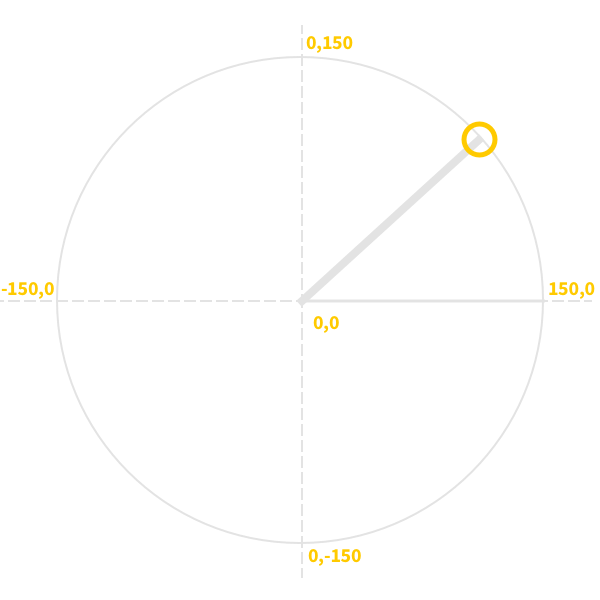
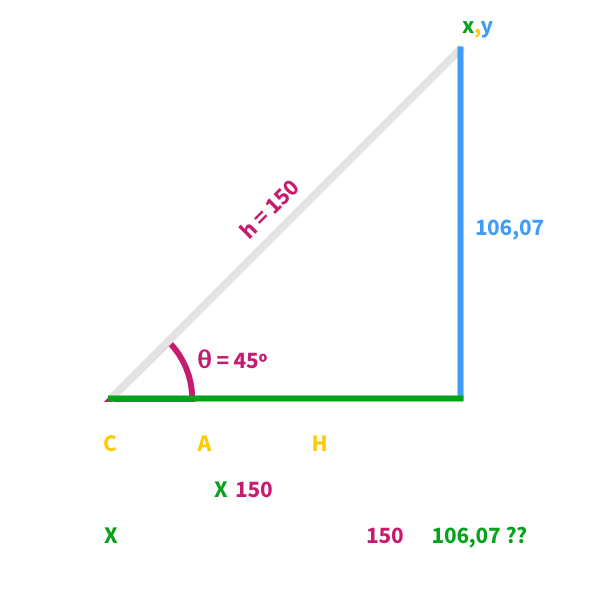
Or any other point along this line?
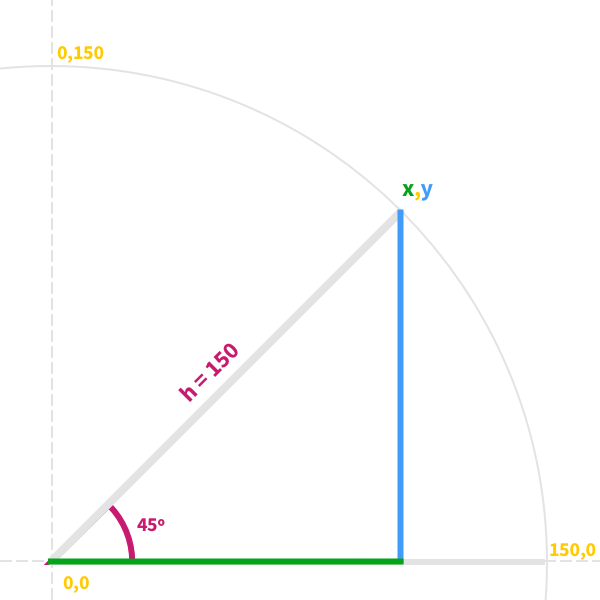
Trigonometry!

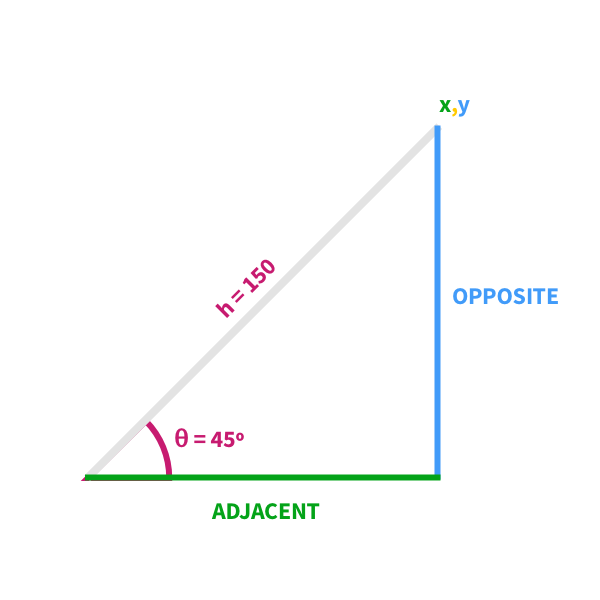
soh
cah
toa
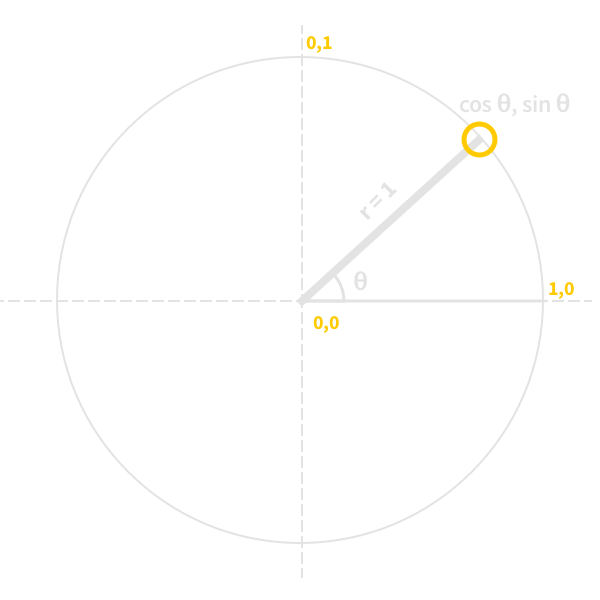
sin(𝛩) = opposite/hypotenuse
cos(𝛩) = adjacent/hypotenuse
tan(𝛩) = opposite/adjacent
Let's try in D3
SETUP

Radians!
What are Radians?
Degrees to Radians
radians = degrees * ∏/180
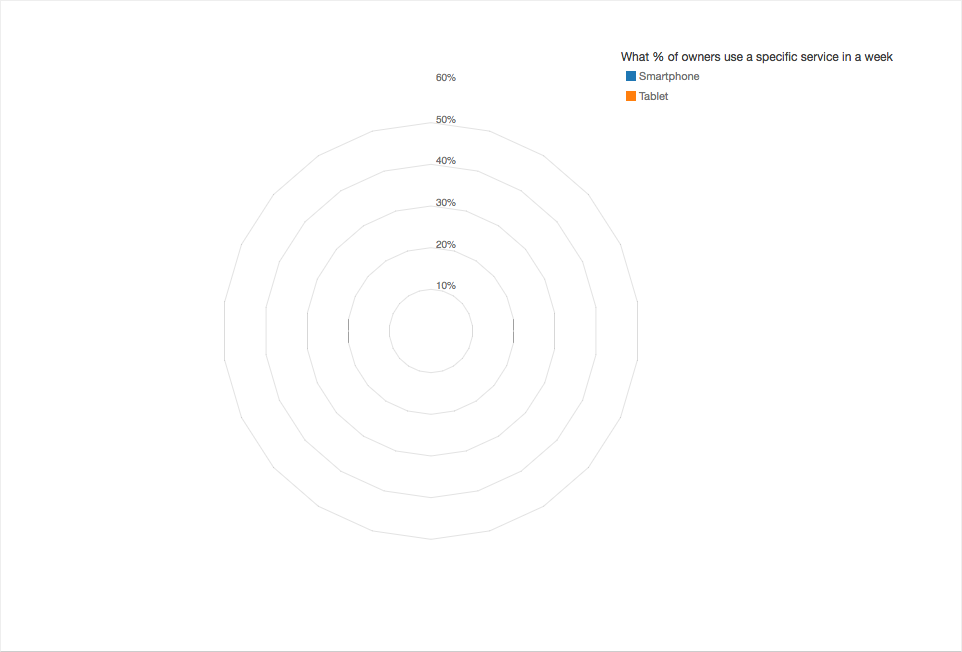
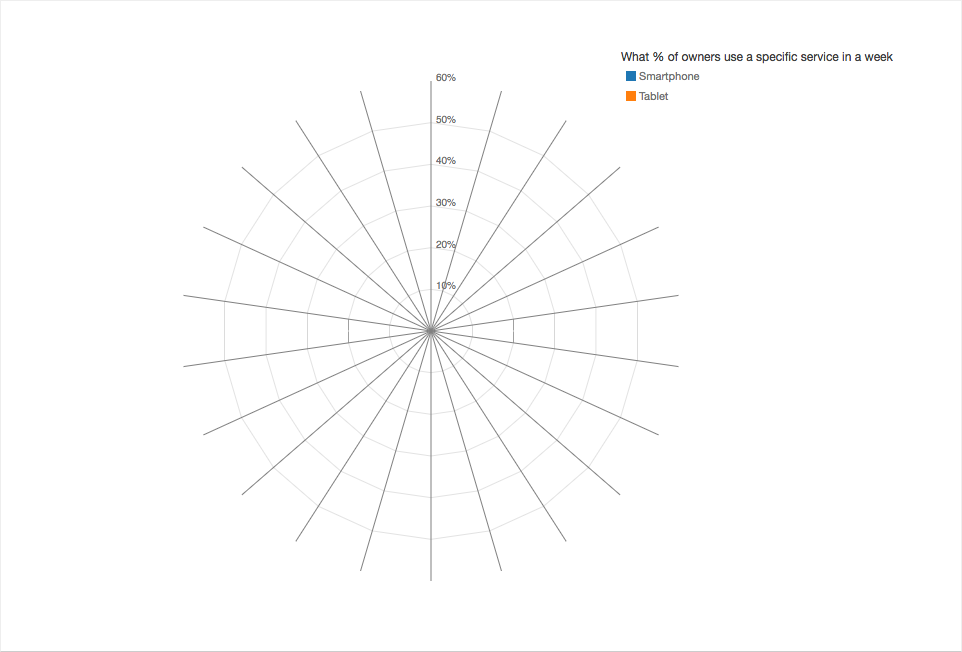
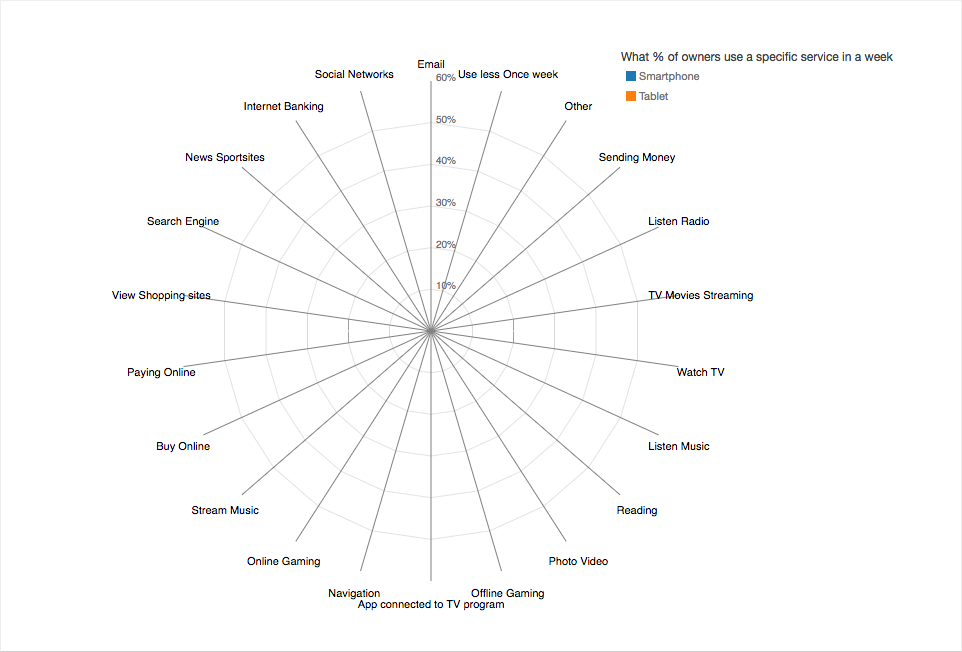
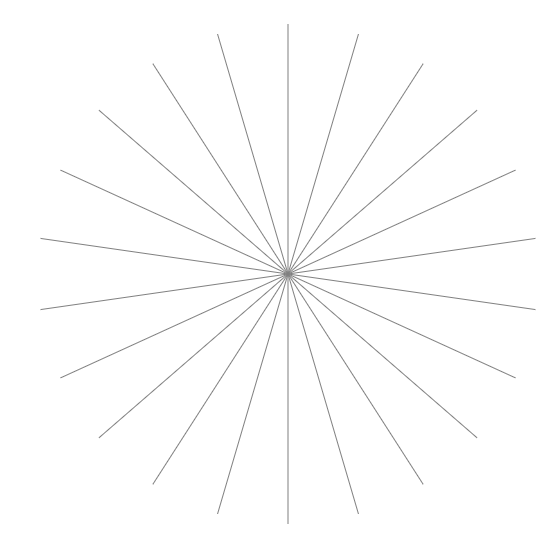
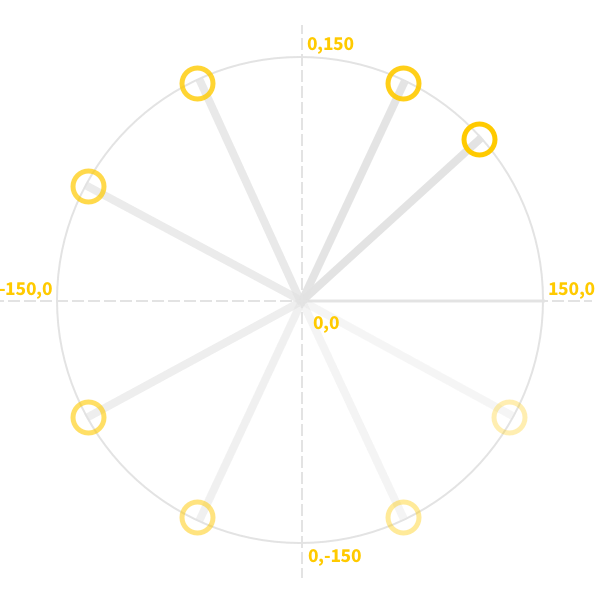
Now let's build a radar
Once Again...
Thanks
jsancha@carto.com
@jorgesancha
One last thing...
WE ARE HIRING!!
https://carto.com/jobs